Add your own track as SVG
Why should I do that?
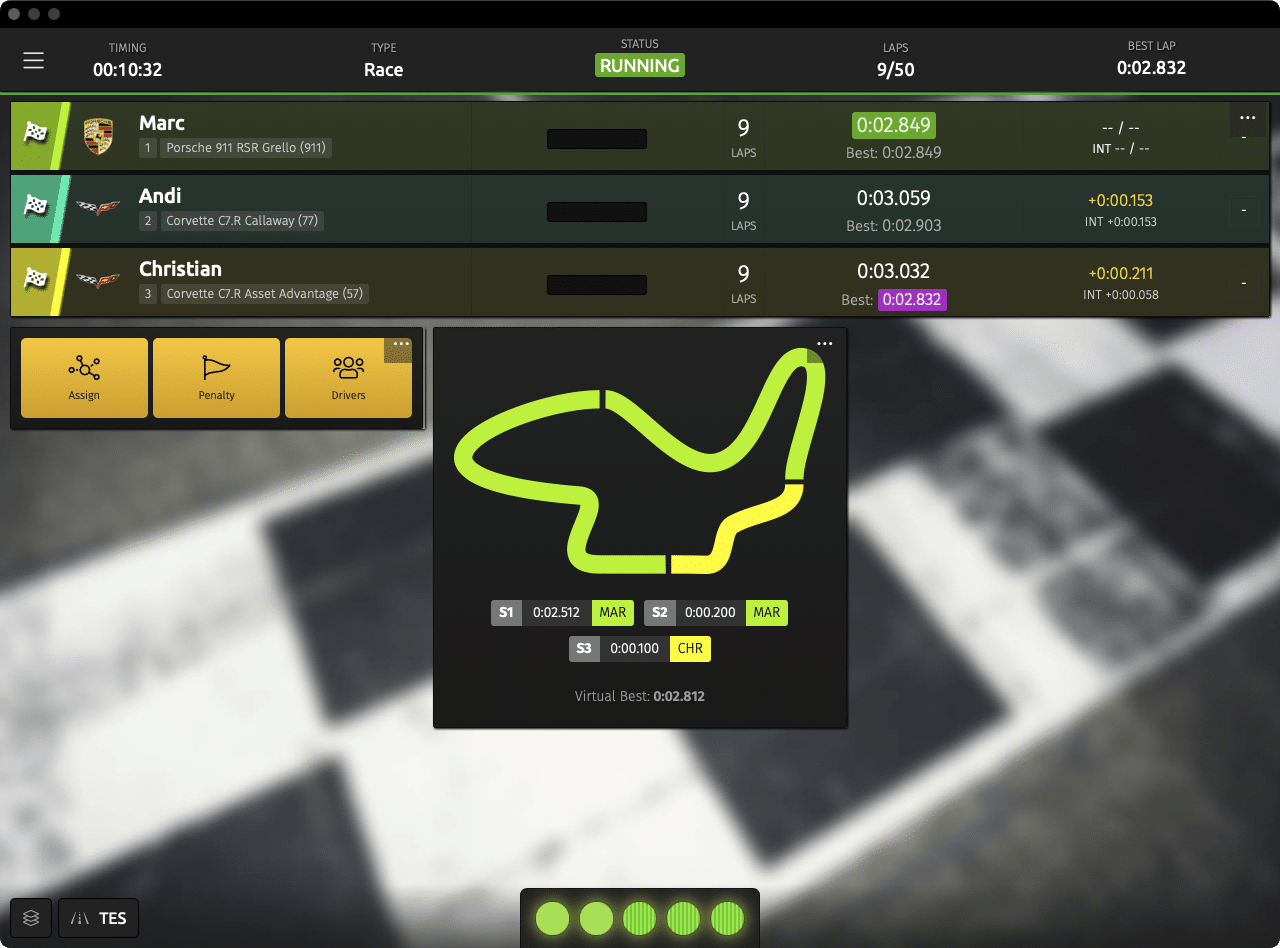
Since SmartRace 5.7 there is a new widget for the race screen: Best Sector Times. This widget displays a graphical track plan to visualize which driver holds the best time in which sector. The sectors are colored in the respective controller color.

Create your own SVG
Did you know? SmartRace user Lukas K. has created an editor that allows you to easily recreate your track and export it as SVG. You can find the editor here.
SmartRace comes with a default track plan that is displayed if no plan has been stored for a track. To create your own track plan, you can use any vector capable graphics program (e.g. CorelDraw, Adobe Illustrator, Gimp, etc.). You can also try to convert any existing track plan into SVG using an online tool.
If you save your track plan as SVG (Scalable Vector Graphic) with the program of your choice, you will get a SVG file that you can open with any text or code editor. The result should look something like the following example.
<?xml version="1.0" encoding="UTF-8"?>
<!DOCTYPE svg PUBLIC "-//W3C//DTD SVG 1.1//EN" "http://www.w3.org/Graphics/SVG/1.1/DTD/svg11.dtd">
<svg xmlns="http://www.w3.org/2000/svg" xml:space="preserve" version="1.1" shape-rendering="geometricPrecision" text-rendering="geometricPrecision" image-rendering="optimizeQuality" fill-rule="evenodd" clip-rule="evenodd" viewBox="0 0 27022.15 12023.11" xmlns:xlink="http://www.w3.org/1999/xlink">
    <g>
        <path style="fill:none;stroke:#555;stroke-width:1200;" id="sector_1" d="M14630.56 11457.61c-24113,1218.71 -10944.78,-18474.44 -6823.7,-7725.05 942.09,2457.35 3621.74,2267.86 6220.47,2468.92"/>
        <path style="fill:none;stroke:#555;stroke-width:1200;" id="sector_2" d="M14327.62 6221.87c6364.11,465.81 5438.96,-4189.4 1689.62,-4578.96 -2252.81,-234.07 -6392.57,-437.79 -8883.14,491.27 -4693.56,1750.86 -3129.45,6917.21 4104.5,6874.64"/>
        <path style="fill:none;stroke:#555;stroke-width:1200;" id="sector_3" d="M11594.94 9007.46c1239.41,-4.3 7415.13,617.18 8942.55,-2062.82 844.98,-1482.59 951.85,-4707.77 2577.79,-4845.51 3762.61,-318.73 5388.85,8816.57 -403.08,9244.74 -3138.09,231.98 -5668.08,141.25 -7724.78,141.25"/>
    </g>
</svg>
In order for your SVG file to be displayed correctly in SmartRace and for the sectors to be highlighted, you need to keep the following in mind:
- Create the sectors as individual (not connected) elements. In the SVG source code there must be as many path elements as there are sectors on your track.
- Each path element for each sector must have an attribute “id” which has as content sector_<number>. So the path element for sector 1 must have sector_1 as id, and so on.
- Do not use external CSS styles, only inline styles. SmartRace uses stroke to color the sectors, not fill.
- Add the finished SVG code in SmartRace to the track database of your track.
